Pune Airport Wraps Up 2025 With New Terminal, Rising Passenger Traffic And Improved Service Standards

Pune Airport Wraps Up 2025 With New Terminal, Rising Passenger Traffic And Improved Service Standards
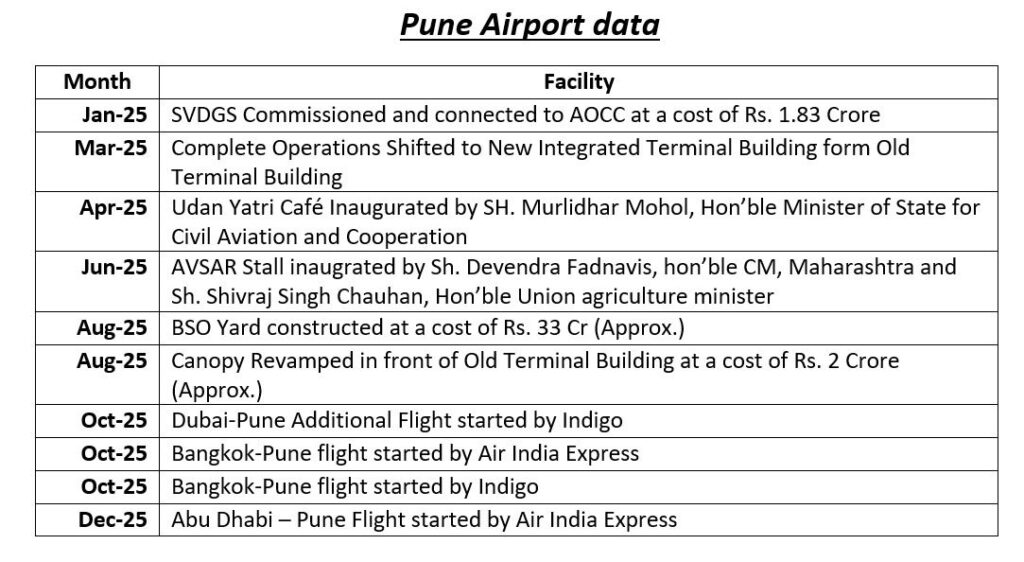
Pune, January 1, 2026: The year 2025 proved to be a landmark phase for Pune International Airport, with major upgrades in infrastructure, operations and passenger services reshaping its overall profile. Airport officials described the past year as a turning point, marked by the full transition to the new Integrated Terminal Building (NITB) and steady growth in traffic and service quality.
According to airport authorities, the most significant development was the complete shift from the Old Terminal Building to the newly commissioned NITB. While the old terminal had a built-up area of 22,300 square metres and could handle around 2,340 passengers during peak hours, the new terminal spans 52,000 square metres with a peak-hour capacity of 3,000 passengers. Wider concourses, improved passenger flow, additional seating and a clearly segregated arrivals and departures system have helped reduce congestion.

The new terminal has also strengthened the airport’s sustainability credentials, earning a GRIHA four-star rating. Facilities such as rainwater harvesting, a sewage treatment plant, energy-efficient lighting, heat-resistant roofing and upgraded HVAC systems have been introduced. To ensure uninterrupted operations, a robust power system with dual electricity connections and advanced monitoring has also been put in place.

Passenger handling facilities expanded alongside the new infrastructure. The airport now has 34 check-in counters, 10 aerobridges, multiple elevators and escalators, and an inline baggage handling system linked to security screening. Digital services were enhanced with the full rollout of DigiYatra e-gates and more than 100 flight information display screens across the terminal.
Operational data highlights the scale of growth. Aircraft movements increased to 70,992 in 2025 from 67,484 the previous year. Passenger traffic crossed 10.86 million, registering a rise of over six per cent. Cargo operations saw even sharper growth, with volumes touching nearly 49,700 metric tonnes, driven largely by domestic shipments of automobile components, pharmaceuticals, perishable goods and e-commerce consignments.
Service quality improvements were reflected in passenger feedback as well. Airport Service Quality scores improved consistently through the year, helping Pune Airport climb in global rankings and emerge as the highest-rated airport operated by the Airports Authority of India.
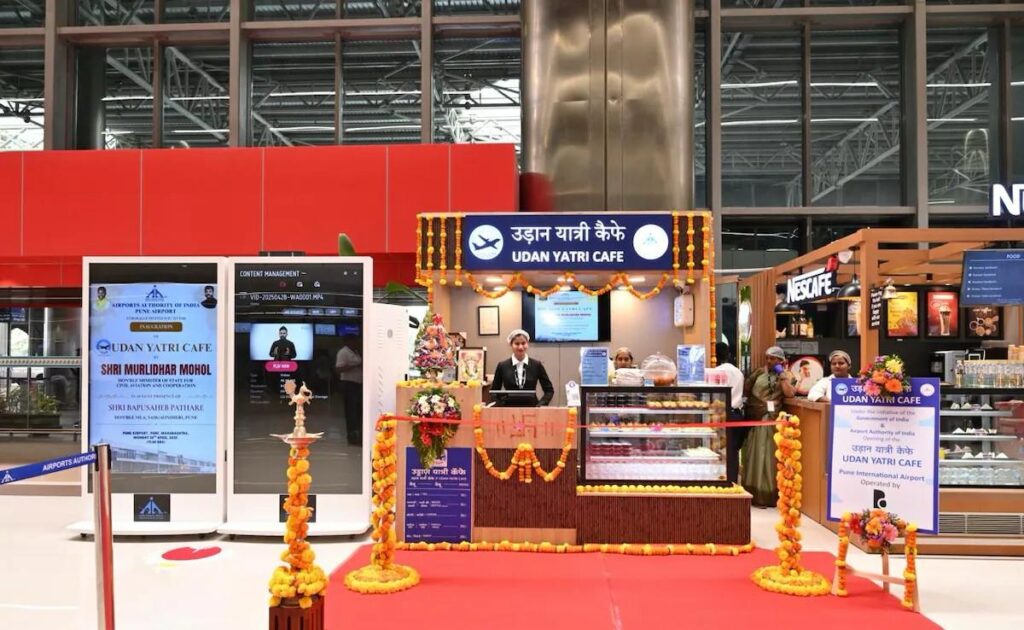
The commercial landscape within the terminal also expanded significantly. The number of outlets rose from 28 to 83, including a wide range of food, beverage and retail options catering to different budgets. Additional lounges and passenger amenities helped improve comfort levels, while employment at commercial facilities increased substantially, resulting in quicker service and reduced waiting times.
Beyond operations, the airport continued community-focused initiatives such as passenger assistance programmes, cultural activities, blood donation camps and environmental drives, all conducted without disrupting daily services.
As 2025 comes to a close, officials say Pune International Airport has evolved into a more efficient, sustainable and passenger-friendly facility, positioning itself for continued growth and higher capacity in the years ahead.
| Aircraft | ||||||
| Month | 2025 | 2024 | ||||
| Int | Dom | Total | Int | Dom | Total | |
| Jan | 227 | 5820 | 6047 | 136 | 5166 | 5302 |
| Feb | 203 | 5153 | 5356 | 107 | 5059 | 5166 |
| Mar | 220 | 5844 | 6064 | 110 | 5543 | 5653 |
| Apr | 210 | 5791 | 6001 | 112 | 5382 | 5494 |
| May | 247 | 5856 | 6103 | 121 | 5606 | 5727 |
| Jun | 211 | 5787 | 5998 | 117 | 5388 | 5505 |
| Jul | 213 | 5850 | 6063 | 123 | 5576 | 5699 |
| Aug | 212 | 5870 | 6082 | 99 | 5653 | 5752 |
| Sep | 202 | 5702 | 5904 | 109 | 5473 | 5582 |
| Oct | 222 | 5867 | 6089 | 105 | 5698 | 5803 |
| Nov | 233 | 5787 | 6020 | 146 | 5641 | 5787 |
| Dec | 201* | 5064* | 5265* | 207 | 5807 | 6014 |
| Total | 2601 | 68391 | 70992 | 1492 | 65992 | 67484 |
· *= Provisional Data
| Passenger | ||||||
| Month | 2025 | 2024 | ||||
| Int | Dom | Total | Int | Dom | Total | |
| Jan | 33278 | 913525 | 946803 | 15578 | 788589 | 804167 |
| Feb | 28508 | 811962 | 840470 | 13590 | 775905 | 789495 |
| Mar | 30122 | 825176 | 855298 | 15472 | 812255 | 827727 |
| Apr | 30127 | 893920 | 924047 | 16142 | 818291 | 834433 |
| May | 34388 | 904164 | 938552 | 18515 | 876078 | 894593 |
| Jun | 25484 | 884774 | 910258 | 16280 | 818659 | 834939 |
| Jul | 23948 | 842415 | 866363 | 15424 | 834229 | 849653 |
| Aug | 24303 | 876914 | 901217 | 13453 | 837786 | 851239 |
| Sep | 22308 | 827906 | 850214 | 12877 | 823296 | 836173 |
| Oct | 28258 | 888925 | 917183 | 14238 | 844991 | 859229 |
| Nov | 30633 | 958602 | 989235 | 20554 | 880039 | 900593 |
| Dec | 27413* | 897586* | 924999* | 33337 | 920934 | 954271 |
| Total | 338770 | 10525869 | 10864639 | 205460 | 10031052 | 10236512 |
· *= Provisional Data
| Cargo | ||||||
| Month | 2025 | 2024 | ||||
| Int | Dom | Total | Int | Dom | Total | |
| Jan | 16.30 | 3556.30 | 3572.60 | 0.00 | 2937.00 | 2937.00 |
| Feb | 2.70 | 3497.60 | 3500.30 | 5.00 | 3100.00 | 3105.00 |
| Mar | 2.70 | 4101.30 | 4104.00 | 3.00 | ||